Charts And Graphs
Advertisement
OLAP Statistics and Reporting for v.1 1
OLAP Statistics and Reporting for Access is a simple and yet powerful tool to let you configure OLAP cube from your databases, and then analyze in multi-dimensional views in grids, charts and graphs, pivoting, drill down/slice and dice and filtering.
Advertisement
Chanalyzer v.3.4.0.0310
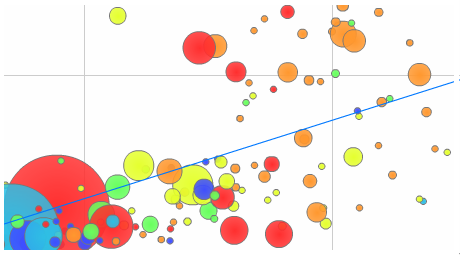
Chanalyzer turns data collected from a Wi-Spy into highly interactive charts and graphs, allowing users to "visualize" their wireless landscape. Together, Wi-Spy and Chanalyzer enable both enterprise and small business users to visualize,
StatTrends v.1.1
StatTrends (formerly "Graph Maker") is a free application for creating interactive charts and graphs.
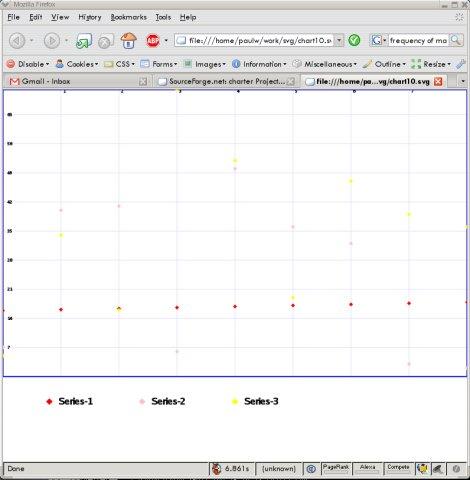
SVG Charter v.alpha.3
This small, sharp tool generates SVG charts and graphs for use in other processes.

Make Professional looking graphs with Java 3d Graph Software v.9.0
With 1-2-3 PieCharts you can now quickly and easily create professional looking 3d graphs without any of the usual hassle.
Infowise Graphs v.1.0.7
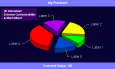
Analyze your list data as simple and visually appealing graphs and charts. Infowise Graphs enables users to create a graphic interface to SharePoint lists, and in the current version contains two web parts with the following abilities: 1. Pie Chart:
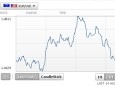
Live Forex Charts
Free, simple and powerful live forex charts software provides traders with comprehensive view of the online trading charts and access to currency rate movements. Real-time fx and currency charts with technical indicators and many online forex trading
Excel Extract Images and Extract Pictures from Multiple Spreadsheets
Do you have a number of different Microsoft Excel spreadsheets with a bunch of different images, perhaps barcharts and graphs, or just regular images, that you would like to easily and effortlessly extract to a directory so you can use them for other
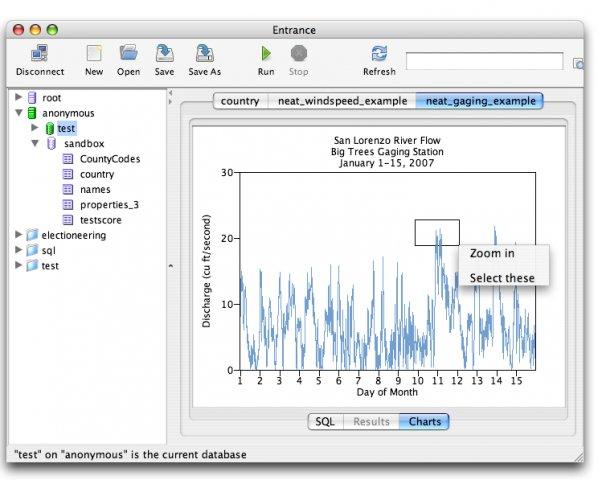
Entrance, The MySQL Browser With Charts v.81
Entrance is the MySQL browser with charts and tools for data exploration.
SM2DGraphView v.1.4
SM2DGraphView framework provides an NSView subclass which draws pie charts or graphs of lines and/or bars including axis labels.
FRONIUS Solar.access v.1.40.1
Fronius Solar.access is intelligent software for recording, archiving and analyzing system data on the PC. It is used for the comprehensive analysis and display of system performance data using clear diagrams and graphs.